Beyond the Surface: Assessing Anterior Segment OCT- Measured Pterygium Height and its Correlation with Dry Eye Disease
Purpose: To correlate the height of pterygium above the ocular surface with dry eye parameters and its association with severity of dry eye disease. Methods: The Pterygium grades were determined. Various dry eye evaluation tests like TBUT, Schirmer’s test and the Tear Meniscus Height were done. The height of the Pterygium was measured with Anterior Segment OCT, by DRI TRITON OCT, taking a 6 mm and 12 mm diameter radial scan. Patients were grouped according to their grade and height measurement. The ANOVA test and Pearson coefficient of correlation test was used to investigate the relationship among the Schirmer tests, Tear Break Up Time, Tear Meniscus Height with the height of pterygium. Results: Fifty pterygium patients were included in this study. It implies that all variables (Schirmer tests , Tear Meniscus Height) differs significantly with the Height of pterygium calculated except Tear Break Up Time which is not significant. The present study verifies the fact that amount of pterygium induced dry eye is directly proportional to Pterygium height above the ocular surface. Conclusion: Most of the pterygium patients showed increase in Dry Eye Disease and its severity with increase in pterygium height.
Abbreviations
DED: Dry Eye Disease; AS-OCT: Anterior Segment Optical Coherence Tomography; ST: Schirmer’s Test; TBUT: Tear Break Up Time Measurement; TMH: Tear Meniscus Height; SD-OCT: Spectral Domain Optical Coherence Tomography.
Introduction
Dry eye disease (DED) is defined as a multifactorial disease of the tears and ocular surface that results in symptoms of discomfort, visual disturbance, and tear film instability with potential damage to the ocular surface [1]. Multiple mechanisms contribute to the development of DED, including tear film disruption caused by ocular surface lesions [2]. Pterygium, one such lesion, is a prevalent degenerative condition of the subconjunctival tissues [3].
Pterygium-induced dry eye disease occurs due to the fibrovascular growth on the ocular surface disrupting the tear film and causing tear film instability [4]. This is exacerbated by chronic inflammation, mechanical friction, limbal stem cell dysfunction, and altered corneal sensitivity [5]. These factors collectively lead to ocular discomfort, reduced tear production, and damage to the ocular surface, characteristic of DED.
The various dimensions of pterygium tissue significantly influences the severity of dry eye disease. Grades: Studies indicate that as the grade of pterygium increases, the severity of DED [6]. Types: Fleshy pterygium is known to induce greater inflammatory changes on the ocular surface, resulting in a higher incidence of DED [7]. Area of Involvement: Increased corneal coverage by the pterygium correlates with a higher prevalence of DED [8].
As the pterygium tissue disrupts the tear film’s integrity by causing an uneven ocular surface, we speculated that a greater elevation of the pterygium above the ocular surface would result in more severe dry eye. This study aims to test that speculation by analyzing the correlation between pterygium height, as measured by anterior segment optical coherence tomography (AS-OCT) and the severity of dry eye.
Material and Methods
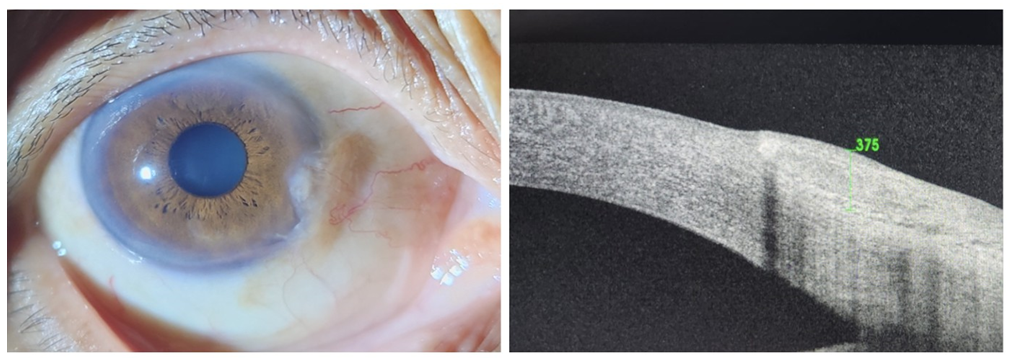
The present study had a transversal, observational and non-interventional design. Participants included were 25 to 70 years of age, diagnosed with any grade of pterygium. Data was collected during the ophthalmologic evaluation at a tertiary health care centre in central India. Ancillary ocular surface evaluation consisted of: Schirmer’s test (ST), Tear Break Up Time measurement (TBUT), Tear meniscus height (TMH). Anterior segment radial scans of diameter 6.0 mm and 16.0 mm were captured with Anterior segment spectral domain optical coherence tomography (SD-OCT) (Topcon).
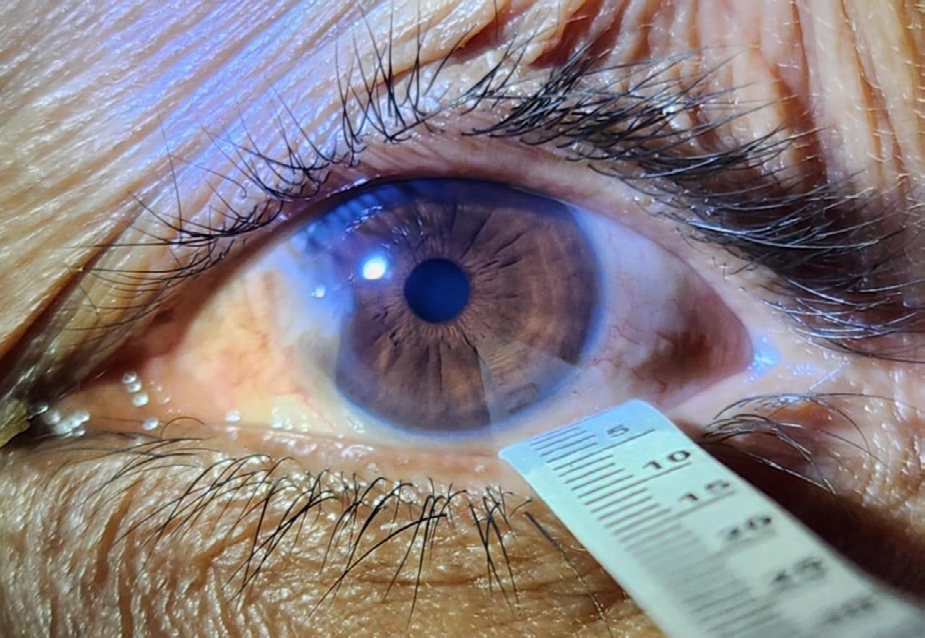
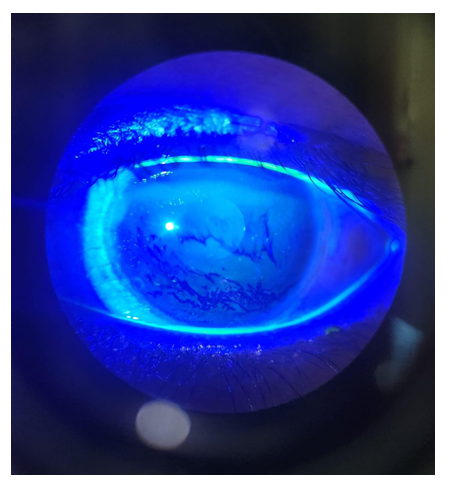
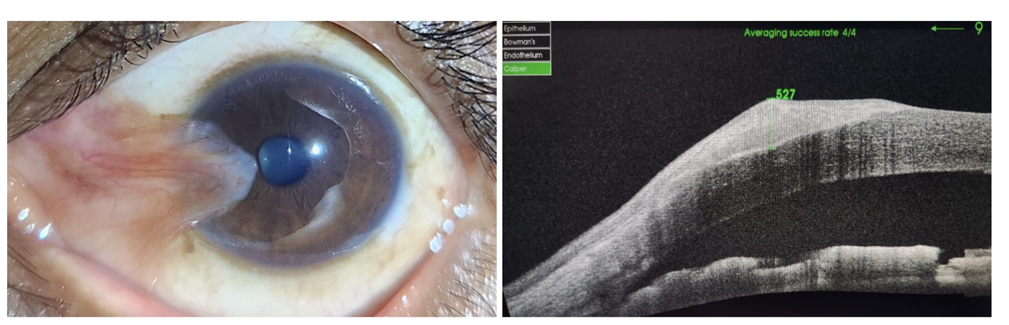
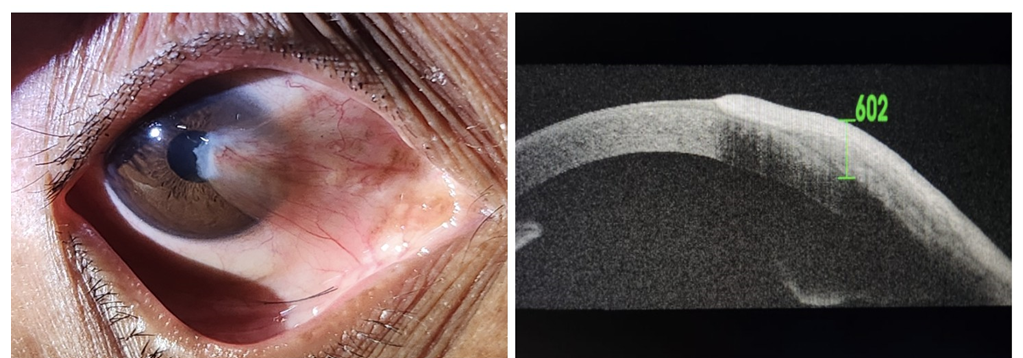
The elevation of the pterygium tissue head above the corneal surface was measured using the caliper tool. Schirmer’s tests with and without anaesthesia were done to measure tear production using filter paper strips in the lower eyelid. Schirmer’s test with anaesthesia tests basal and reflex tears (normal >10 mm), while Schirmer’s test without anaesthesia tests basal tears (normal >5 mm), distinguishing between basal and reflex tear deficiency. TBUT was recorded by instilling fluorescein dye and timing the first appearance of a dry spot on the cornea; it evaluates tear film stability, normal TBUT is over 10 seconds. TMH was calculated by measuring tear volume at the lower eyelid margin with a slit lamp; normal value is over 0.2 mm, indicating sufficient tear volume. The data collected was qualitative in nature and ANOVA test and Pearson coefficient of correlation test was used to calculate the association between these variables (Figures 1-6).
Results
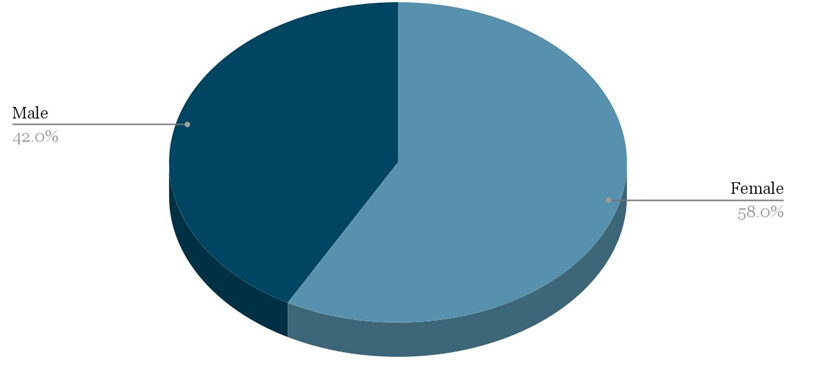
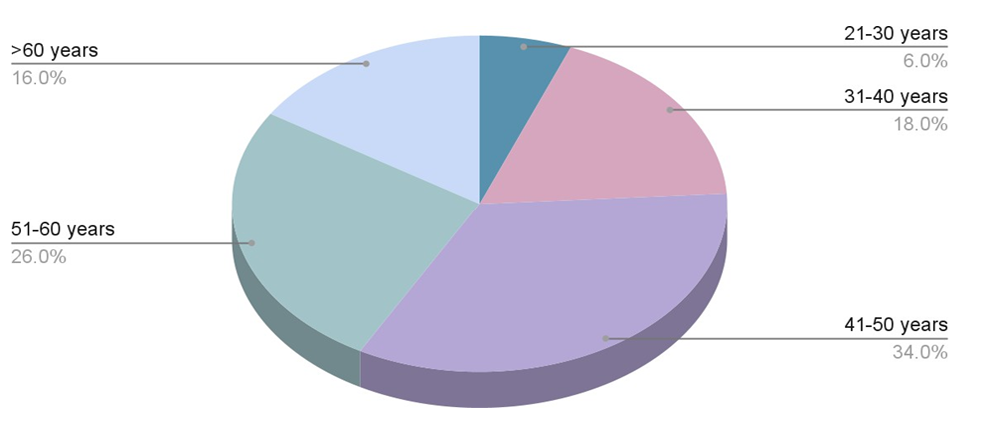
The study included 21(42%) males and 29 (58%) females (Table 1) with a mean age of 49.16 ±11.77 years with the age range of 22 to 77 years. The maximum number of cases (34%) was between 41 and 50 years (Table 2, Figure 7).
| Sex | Number | Percentage (%) |
|---|---|---|
| Female | 29 | 58 |
| Male | 21 | 42 |
| Total | 50 | 100 |
| Age | Number | Percentage (%) |
| 21-30 years | 3 | 6 |
| 31-40 years | 9 | 18 |
| 41-50 years | 17 | 34 |
| 51-60 years | 13 | 26 |
| >60 years | 8 | 16 |
| Total | 50 | 100 |
Table 1: Distribution of patients according to sex (N=50).
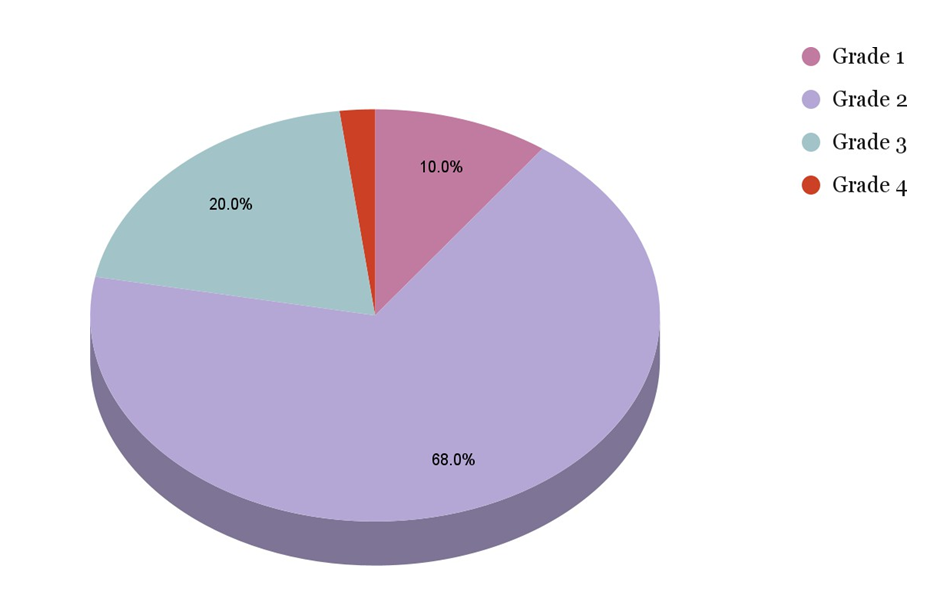
Grade 1 pterygium was present in 5 (10%) patients; Grade 2 in 34 (68%) patients; Grade 3 in 10 (20%) patients; and Grade 4 in 1 (2%) patient. Most of the patients had Grade
2 and Grade 3 pterygium (Figures 8 & 9) (Table 3).
| Pterygium grade | Number | Percentage (%) |
|---|---|---|
| Grade 1 | 5 | 10 |
| Grade 2 | 34 | 68 |
| Grade 3 | 10 | 20 |
| Grade 4 | 1 | 2 |
| Total | 50 | 100 |
Table 2: Distribution of patients according to pterygium grade (N=50).
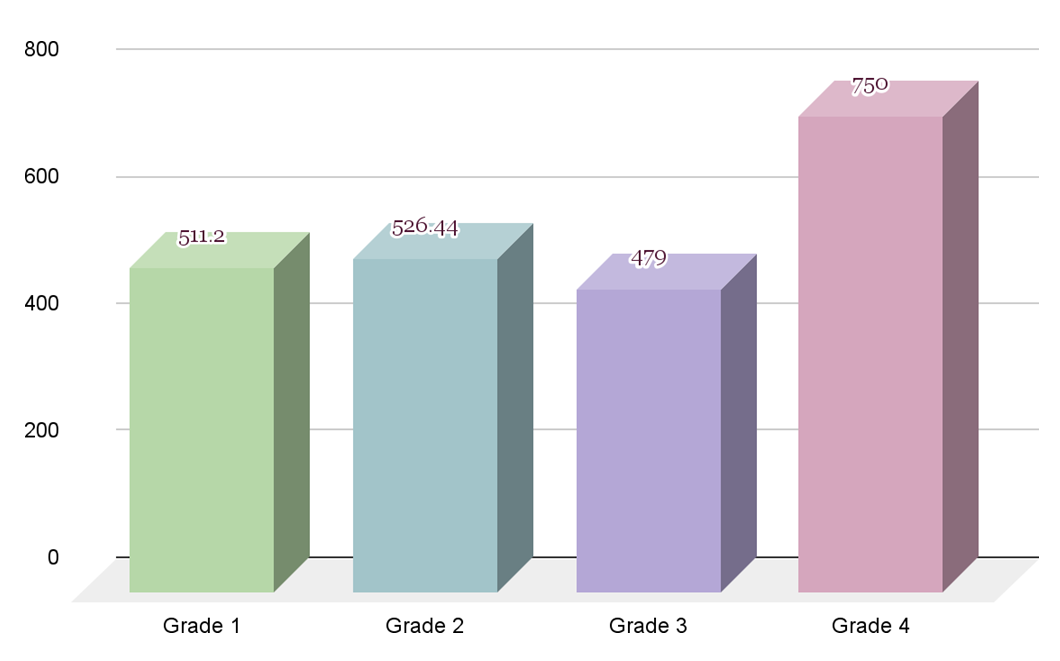
The mean AS-OCT score in Grade 1 pterygium patients was 511.20 ± 176.26; in Grade 2 it was 526.44 ± 126.24; in Grade 3 it was 479.00 ± 193.53; and in Grade 4, it was 750.00. We found no significant difference in the mean AS-OCT score in relation to pterygium grades (P=0.355) (Table 4, Figure 10).
| Pterygium Grades | No. | AS-OCT Score [Mean ± SD] | Range of AS-OCT score | F value | P value |
|---|---|---|---|---|---|
| Grade 1 | 5 | 511.20 ± 176.26 | 240-590 | 1.111 | 0.355, NS |
| Grade 2 | 34 | 526.44 ± 126.24 | 210-728 | ||
| Grade 3 | 10 | 479.00 ± 193.53 | 213-588 | ||
| Grade 4 | 1 | 750 | 750 | ||
| Total | 50 |
Table 3: Comparison of mean AS-OCT Score in relation to pterygium grades (N=50).
One-way ANOVA test applied. A p value =0.355, Not Significant Table 4: Comparison of mean AS-OCT Score in relation to pterygium grades (N=50).
On analysis, we found that both Schirmer 1 at 2 minutes as well as at 5 minutes had a fair, negative and statistically significant correlation with AS-OCT (P<0.05). With the decrease in Schirmer 1 test value at 2 minutes and 5 minutes, there is an increase in AS-OCT score (Table 5).
| Pair | ‘r’ value | P value | Interpretation |
|---|---|---|---|
| Schirmer 1 (at 2 minutes) and AS-OCT | -0.497 | 0.001* | There was negative, fair, statistically significant correlation |
| Schirmer 1 (at 5 minutes) and AS-OCT | -0.418 | 0.003* | There was negative, fair, statistically significant correlation |
Table 4: Correlation between Schirmer 1 test results at 2 minutes and 5 minutes of pterygium eye, and AS-OCT (N=50).
Pearson coefficient of correlation test applied. A p value of <0.05 was considered as statistically significant Table 5: Correlation between Schirmer 1 test results at 2 minutes and 5 minutes of pterygium eye, and AS-OCT (N=50).
We also noted that Schirmer 2 at 2 minutes had a good, negative and statistically significant correlation with AS-OCT (P<0.05), while Schirmer 2 at 5 minutes had a fair, negative and statistically significant correlation with AS-OCT (P<0.05). With the decrease in Schirmer 2 test value at 2 minutes and 5 minutes, there is an increase in AS-OCT score (Table 6).
| Pair | ‘r’ value | P value | Interpretation |
|---|---|---|---|
| Schirmer 2 (at 2 minutes) and AS-OCT | -0.549 | 0.001* | There was negative, good, statistically significant correlation |
| Schirmer 2 (at 5 minutes) and AS-OCT | -0.424 | 0.002* | There was negative, fair, statistically significant correlation |
Table 5: Correlation between Schirmer 2 test results at 2 minutes and 5 minutes of pterygium eye, and AS-OCT (N=50).
Pearson coefficient of correlation test applied. A p value of <0.05 was considered as statistically significant Table 6: Correlation between Schirmer 2 test results at 2 minutes and 5 minutes of pterygium eye, and AS-OCT (N=50).
We found a negative, very weak, statistically not significant correlation between TBUT of pterygium eye and AS-OCT (Table 7). There was a negative, weak, statistically significant correlation between TMH of pterygium eye and AS-OCT (P=0.005). With the decrease in TMH, there is an increase in AS-OCT score. (Table 8).
| Pair | ‘r’ value | P value | Interpretation |
|---|---|---|---|
| TBUT of pterygium eye and AS- OCT | -0.145 | 0.315, NS | There was negative, very weak, statistically not significant correlation |
| TMH of pterygium eye and AS-OCT | -0.393 | 0.005* | There was negative, weak, statistically significant correlation |
Table 6: Correlation between TBUT of pterygium eye and AS-OCT (N=50).
Pearson coefficient of correlation test applied. A p value of <0.05 was considered as statistically significant Table 7: Correlation between TBUT of pterygium eye and AS-OCT (N=50).
Pearson coefficient of correlation test applied. A p value of <0.05 was considered as statistically significant Table 8: Correlation between TMH of pterygium eye and AS-OCT (N=50).
Discussion
Dry eye disease (DED) is characterized as a complex condition affecting both the tears and the surface of the eye, resulting in discomfort, visual disturbances, and instability of the tear film, potentially causing harm to the ocular surface. Various factors contribute to the development of DED, including disruption of the tear film due to lesions on the ocular surface. One common type of such lesion is pterygium, which is a degenerative condition of the subconjunctival tissues that proliferate as vascularized granulation tissue.
Pterygium induced dry eye disease is caused by disrupted homeostasis of the tear film and ocular surface. The fibrovascular growth mechanically interferes with the even distribution and stability of the tear film, leading to increased tear evaporation and tear film instability. Additionally, the chronic inflammatory milieu associated with pterygium adversely affects the function of the lacrimal glands and conjunctival goblet cells, resulting in reduced aqueous tear production and mucin secretion, which are critical for maintaining tear film integrity [9].
This study stands out due to its novelty in exploring the correlation between the height of pterygium above the corneal surface and its association with Dry Eye Disease, a relationship not previously investigated.
Our analysis reveals, pterygium occurrence showed a higher prevalence among females (58%). While in a previous study, Nangia V, et al. [10] higher prevalence was noted in males. This correlation was attributed to increased exposure to sunlight and dust, commonly encountered during outdoor pursuits. In our investigation, the majority of patients were aged between 40 and 50 years (37%), which was similar to Veena MSB, et al. [11] and Lin A, et al. [12] where the maximum number of cases (44%) was between 41 and 50 years.
Among the total of 50 pterygium cases, the highest proportion (68%) fell into the category of grade 2 pterygium. This finding mirrored a previous study [7], which observed that out of a total of 75 pterygium cases, the majority (65.8%) were classified as grade 2 nasal pterygium. Similarly, Zhang et al. reported that most patients in their study also presented with grade 2 pterygium. Our data indicates no correlation between the grade of pterygium and its height i.e., a greater heighted pterygium can be encountered in lower grades as well. No previous study has noted this correlation.
Our results demonstrate a significant correlation between the mean Schirmer’s Test (ST) values and the AS- OCT score, i.e., the height of the pterygium above the corneal surface (P<0.05). This observation aligns with the findings of Rahman A, et al. [13] and Chaidaroon W, et al. [14], and Antony AT, et al. [15] who similarly reported a significant decrease in ST values in eyes affected by pterygium. Roka N, et al. [16] and Kadayifçilar SC, et al. [17] also found that ST values were lower among cases than their corresponding control eyes, whereas Biedner B, et al. [18] performed ST in cases with unilateral pterygia and found no difference between the mean basic secretion of tears in the diseased eyes and the fellow eyes and suggested that dryness of the eyes cannot be regarded as the cause of pterygium. Bandyopadhyay R, et al. [19] and Ergin A, et al. [20] did not find the difference in pterygium and control group and concluded that there were no tear function abnormalities in pterygium. This research is unique in its investigation of the previously unexplored correlation between pterygium height and Schirmer’s test scores.
In the present study, the correlation observed between the TBUT of the eyes affected by pterygium and the AS- OCT score was noted to be negative, exhibiting very weak significance and lacking statistical relevance (P = 0.315). This outcome contrasts with the findings of Rajiv, et al. [21], El- Sersy TH, et al. [22] and Manhas A, et al. [23], as documented in their respective studies. They reported significantly decreased TBUT values among pterygium cases, leading to insufficient Tear Film (TF) stability. Whereas we found a negative, weak, statistically significant correlation between TMH of pterygium eye and AS-OCT score (P=0.005).
In our assessment, we investigated the correlation between pterygium height, as measured on AS-OCT, and the severity of dry eye by assessing Schirmer’s Test (ST), Tear Break-Up Time (TBUT), and Tear Meniscus Height (TMH). Our analysis revealed that TMH showed a significant decrease (P< 0.05), and there were statistically significant differences in ST results with an increase in pterygium height; on the other hand, TBUT did not exhibit a significant reduction overall and was statistically insignificant (P > 0.05).
Our study shows that there is directly proportional correlation between the pterygium height above the corneal surface and severity of dry eye disease experienced by the patient.
Conclusion
Dry eye is known to stem from various environmental and habitual factors. The significantly higher incidence of dry eye observed in eyes with greater pterygium height, as evidenced in this study, suggests that increasing pterygium height contributes to abnormal ocular surface conditions, leading to dysfunctional Tear Film and the development of dry eye. This relationship appears to be independent of the grade of pterygium and underscores the importance of addressing pterygium-induced ocular surface changes in managing dry eye.
References
-
Craig JP, Nichols KK, Akpek EK, Caffery B, Dua HS, et al. (2017) TFOS DEWS II definition and classification report. Ocul Surf 15(3): 276-283.
-
Messmer EM (2015) The pathophysiology, diagnosis, and treatment of dry eye disease. Dtsch Arztebl Int 112(5): 71-82.
-
Gupta AK, Nathwani Y (2019) Correlation between pterygium and dry eye. Kerala Journal of Ophthalmology 31(3): 217-220.
-
Roka N, Shrestha SP, Joshi ND (2013) Assessment of tear secretion and tear film instability in cases with pterygium and normal subjects. Nepal J Ophthalmol 5(1): 16-23.
-
Rao SK, Mohan R, Gokhale N, Matalia H, Mehta P (2022) Inflammation and dry eye disease-where are we?. Int J Ophthalmol 15(5): 820-827.
-
Shreya T, Singh SO, Agrawal D, Modi G (2023) Correlation of the Different Grades of Pterygium with Severity of Dry Eye Disease. Journal of Ophthalmology Research Reviews & Reports, pp: 1-5.
-
Ang LP, Chua JL, Tan DT (2007) Current concepts and techniques in pterygium treatment. Curr Opin Ophthalmol 18(4): 308-313.
-
Shreya T, Singh SO, Modi G (2023) Correlation of Pterygium Induced Severity of Dry Eye Disease with Total Surface area of Pterygium. Mathews Journal of Ophthalmology 8(2).
-
Stern ME, Gao J, Siemasko KF, Beuerman RW, Pflugfelder SC (2004) The role of the lacrimal functional unit in the pathophysiology of dry eye. Exp Eye Res 78(3): 409-416.
-
Nangia V, Jonas JB, Nair D, Saini N, Nangia P, et al. (2013) Prevalence and associated factors of pterygium in rural agrarian central India. The Central India Eye and Medical Study. PLoS One 8(12): e82439.
-
Veena MSB, Priyadarshani DA, Gaurav B (2013) Pterygium - a study which was done on a rural based population. J Clin Diagn Res 7(9): 1936-1937.
-
Lin A, Stern G (1998) Correlation between Pterygium size and induced corneal astigmatism. Cornea 17(1): 28- 30.
-
Rahman A, Yahya K, Fasih U, Huda WU, Shaikh A (2012) Comparison of Schirmer’s test and Tear film breakup time test to detect tear film abnormalities in patients with pterygium. J Pak Med Assoc 62(11): 1214-1216.
-
Chaidaroon W, Pongmoragot N (2003) Basic tear secretion measurement in pterygium. J Med Assoc Thai 86(4): 348-352.
-
Antony AT, Mini PA, Dalia S (2017) Pterygium and dry eye-a clinical correlation. J Med Sci Clin Res 5(6): 23654- 23659.
-
Roka N, Shrestha SP (2011) Assessment of tear secretion and tear film instability in cases with pterygium and normal subjects. Nepal J Ophthalmol 3(1): 31-38.
-
Kadayifçilar SC, Orhan M, Irkeç M (1998) Tear functions in patients with pterygium. Acta Ophthalmol Scand 76(2): 176-179.
-
Biedner B, Biger Y, Rothkoff L, Sachs U (1979) Pterygium and basic tear secretion. Ann Ophthalmol 11(8): 1235- 1236.
-
Bandyopadhyay R, Nag D, Mondal SK, Gangopadhyay S, Bagchi K, et al. (2010) Ocular surface disorder in pterygium: Role of conjunctival impression cytology. Indian J Pathol Microbiol 53(4): 692-695.
-
Ergin A, Bozdoğan O (2001) Study on tear function abnormality in pterygium. Ophthalmologica 215(3): 204-208.
-
Rajiv, Mithal S, Sood AK (1991) Pterygium and dry eye – A clinical correlation. Indian J Ophthalmol 39(1): 15-16.
-
El-Sersy TH (2014) Role of pterygium in ocular dryness. J Egypt Ophthalmol Soc 107(4): 205-208.
-
Manhas A, Gupta D, Manhas RS, Gupta RK, Manhas GS (2017) Comparison of tear film break-up time with Schirmer’s test with anesthesia to detect tear film abnormality in patients with pterygium – A study from Jammu and Kashmir. Int J Sci Stud 5(3): 81-85.
- Screening of Hospital Staff During World Glaucoma Week in a Tertiary Eye Care Centre
- Angioid Streaks with Macular Neovascularization: Clinical Insights from Two Cases
- Giant Kissing Naevus: An Oculoplastic Challenge
- Why Freedom of Vision Should Not Cost the Freedom of Feeling - LASIK in the Climate of Change
- Asymmetric Optic Nerve with Small Disc and Large Cup: A Rare and Challenging Case of Unilateral Optic Nerve Hypoplasia
- Large Angle Exotropia in a Child: A Case Report